Case Study – Analyzing an Investment Opportunity
The purpose of this case study is to illustrate the steps involved in analyzing a residential investment opportunity. It may not cover all aspects of the investment analysis but it is very comprehensive. Where applicable, there are links to more explanation of the topics throughout this post.
The objective is to show how one, systematically and objectively, can quantify the before-tax and after-tax cash flows, the proceed from the sale, the taxes due on sale, and the performance of the investment taking into account the income, financing, operating expenses, and his/her tax brackets.
Here is another buzz word: this analysis provides a Financial Management Rate of Return (FMRR) compared to the Internal Rate of Return (IRR). In FMRR, the income from the investment is taken out, re-invested in another instrument (no longer internally reinvested).
There are a number of worksheets in the spreadsheet used to provide the analysis. They are, for most parts, self explanatory. I will touch on the highlights. The images of the worksheets are posted below. Please feel free to contact me for a PDF version or access to the spreadsheet. The spreadsheet allows one to evaluate the What-If scenarios by changing the variables highlighted in yellow.
And, finally, my disclaimer: The spreadsheet has been evolved over the years. Although extreme care has been taken and believe accurate, I cannot guarantee that. The spreadsheet is only for evaluating an investment opportunity. Please consult with your tax/finance professional.
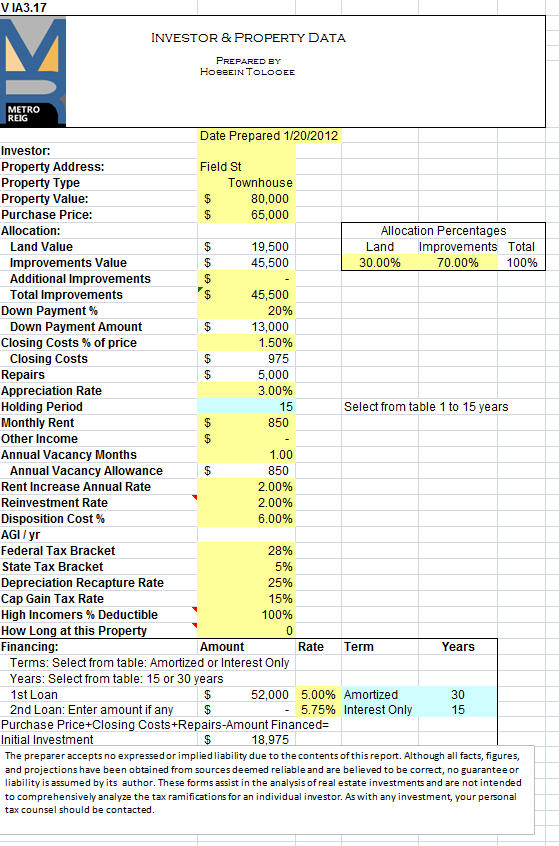
The first worksheet, below, is the data on the investor and the property. A couple in their 28% tax bracket are purchasing a townhouse for $65,000 in Denver, CO. The current market value is $80,000. The townhouse needs about $5,000 worth of repairs. It will be financed for 30 years at 5%. They want to sell the townhouse after 15 years, as they are planning to use the funds for their newly born son’s college expenses.
- The value of the property is broken in Land and Improvement for deprecation purpose.
- The appreciation rate is the average over the holding period.
- Holding period is the number of years one holds on to a property.
- It is assuming the disposition of the property is a sale (as opposed to 1031 exchange, charitable trust, etc)
- Reinvestment rate is the rate the income (if any) from the property is invested elsewhere.
- The tax brackets are the investor’s federal and state tax rates used in determining the cash-flows and taxes due at sale.
- The Depreciation Recapture (Cost Recovery) rate is the tax rate on the amount depreciated when the property is sold.
- Capital Gain rate is the tax rate on the gains when sold.
- The example assumes the property is financed for 30 years. The investor is selling in the 15th year.
- How long at This Property is for when turning a residence to a rental. Not use in this example.
The operating expenses are on annual bases. They are typical for a townhouse similar to this example. The management fee assumes a leasing fee and the monthly management fees since allowing for one month of vacancy.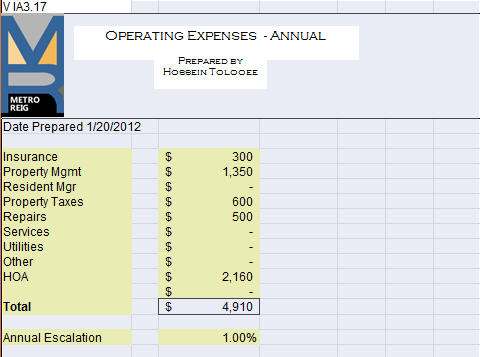
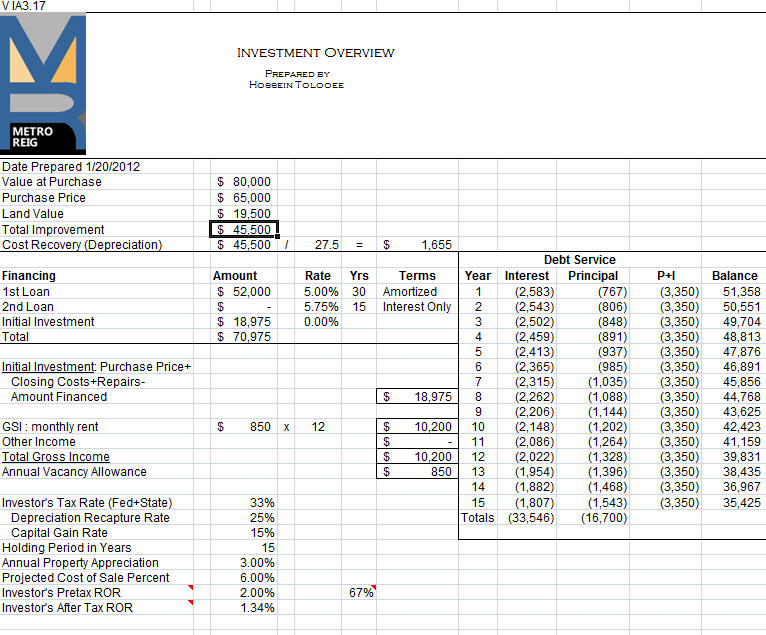
The Investment Overview summarizes some of the facts from the 1st spreadsheet.
- The debt service (the loan) values are shown for the 15 years the property is held. The loan is amortized over 30 years.
- Gross income is as if no vacancy.
- Investor’s tax rate is the sum of the federal and state rates (33%)
- The re-investment rate was assumed to be 2%. That is the rate the income (if any) would be invested elsewhere. 33% of it is taxed leaving the 1.34% after-tax Rate of Return.
The Center of the universe is the NOI (net operating income). Most figures are driven from NOI.
NOI = Gross and other Incomes – Vacancies – Operating Expenses.
Note: only op expenses, interests not included here. The interest is accounted for in CFBT.
Cash Flow Before Tax (CFBT) is the NOI less Debt Service. The Debt Service includes Principal and Interest. CFBT is projected over the holding period.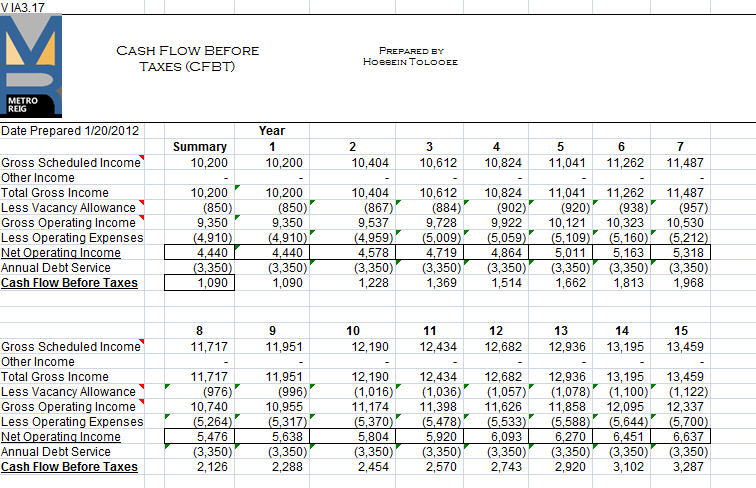
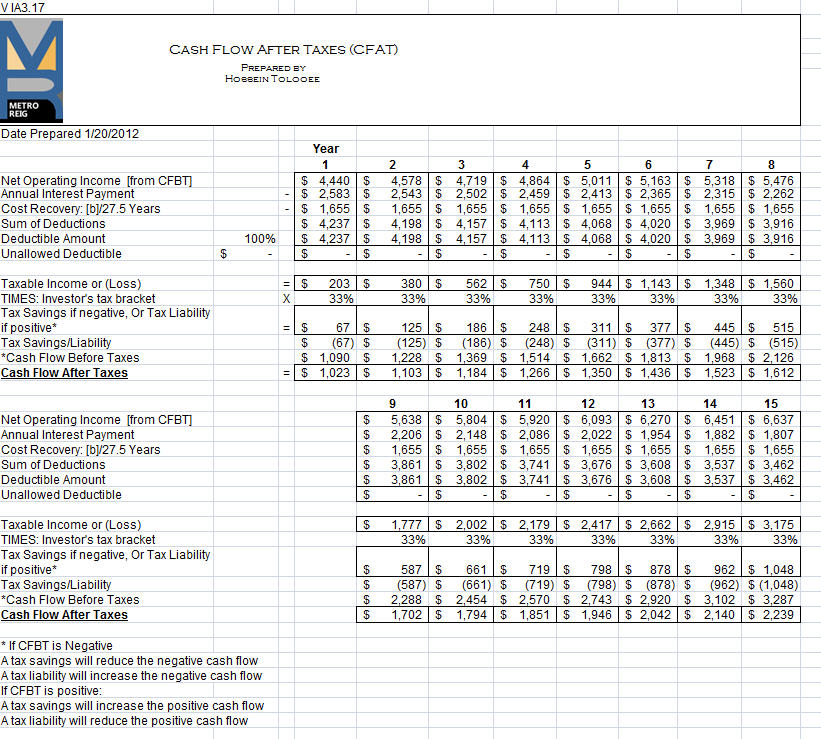
Cash Flow After Tax (CFAT) is calculated by
- Subtracting from the NOI the annual interest payment and the depreciation.
- Then, multiplying the results by the investor’s tax rate. That is the tax liability or savings
- Add or subtract that amount from/to CFBT to arrive at CFAT.
The Value of the property is compounded over the holding period at the assumed appreciation rate. See Time Value of Money.
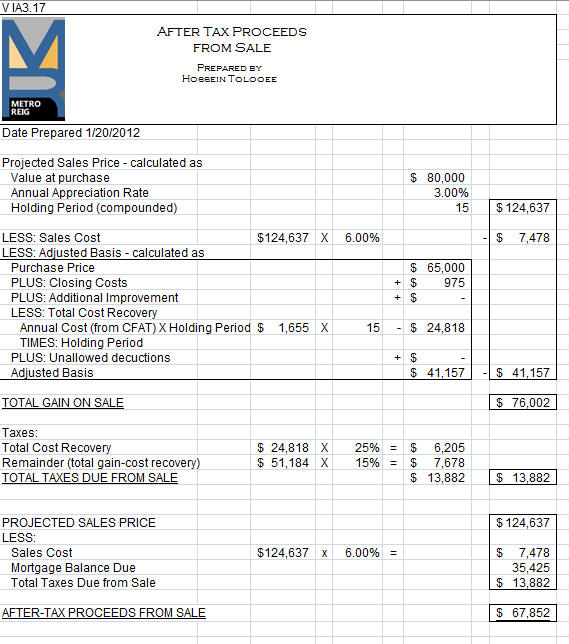
The Adjusted Basis is used to calculate the total gains from the sale of the property. The gains are taxed at 2 levels. The Cost Recovery (Depreciation) portion is taxed at 25%. The remainder of the gains is taxed at the long term capital gain rate.
The After Tax Proceeds from the Sale, then, is the sale price less cost of the sale, the mortgage balance, and the taxes due.
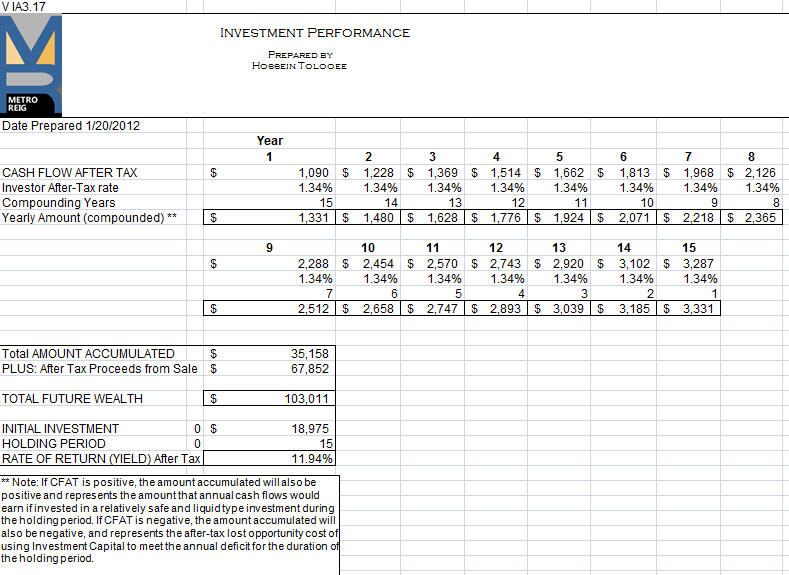
The Total Future Wealth is the total of all period’s cash flows compounded at the investor’s after tax-ROR over the remaining years PLUS the After Tax Processed from Sale.
For example, the first year income is compounded over 15 years, 2nd year over 14 year, and so on.
Then taking the Total Future Wealth and discounting it over the holding period results in your after tax yield on the investment.
** Note: If CFAT is positive, the amount accumulated will also be positive and represents the amount that annual cash flows would earn if invested in a relatively safe and liquid type investment during the holding period. If CFAT is negative, the amount accumulated will also be negative, and represents the after-tax lost opportunity cost of using Investment Capital to meet the annual deficit for the duration of the holding period.
Metro RE Investment Group & Property Management, a Metro Brokers® Company, is a full service brokerage firm with a specialty in Residential Property Management serving Denver Metro and Boulder County for 10 years.

